The Statistics page lives at Therapy > Statistics. It is built for a specific purpose: to give you, the therapist, an honest read of your own caseload activity over a period you choose, calculated entirely in your browser, never sent anywhere. The same numbers can also be useful in supervision when you want to talk about patterns of attendance, no-shows, or the spread of your week.
This article walks through the controls at the top of the page, the headline numbers, the breakdown tables, and one column that sometimes confuses people on first read.
The filter row
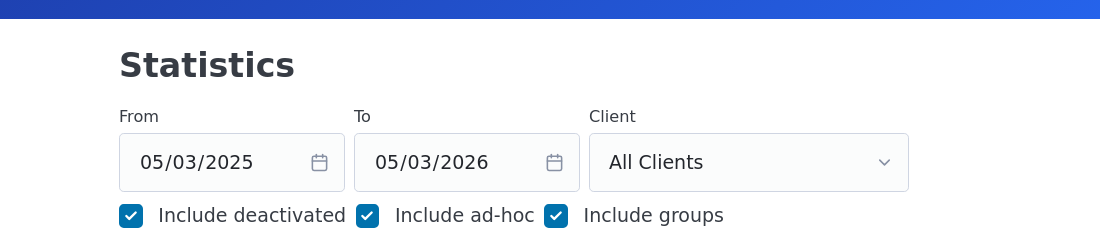
The page opens with a 12-month window ending today. Change From and To to whatever you want; the figures recompute as soon as the dates are valid. Client defaults to All Clients and shows every client in the dropdown including ad-hoc, deactivated, and groups, prefixed with their type so a glance at the dropdown tells you what is what.
Three tickboxes control which records the calculations include:
Include deactivated keeps clients you have set to inactive in the totals. Off, and they drop out completely, including any notes saved while they were active. Useful if you want a "current caseload only" view.
Include ad-hoc keeps the bucket of one-off / drop-in notes that were saved with the Ad-hoc tickbox on the dashboard. These notes have no formal client record, so they sit outside the by-client breakdowns. Off, and the totals only count notes attached to formal clients.
Include groups keeps clients that you marked Group on the client form. Off, and group sessions drop out of every count. Useful if you want a "individual clients only" view, or vice versa, a "group sessions only" view by ticking groups but unticking the others mentally.
The headline numbers
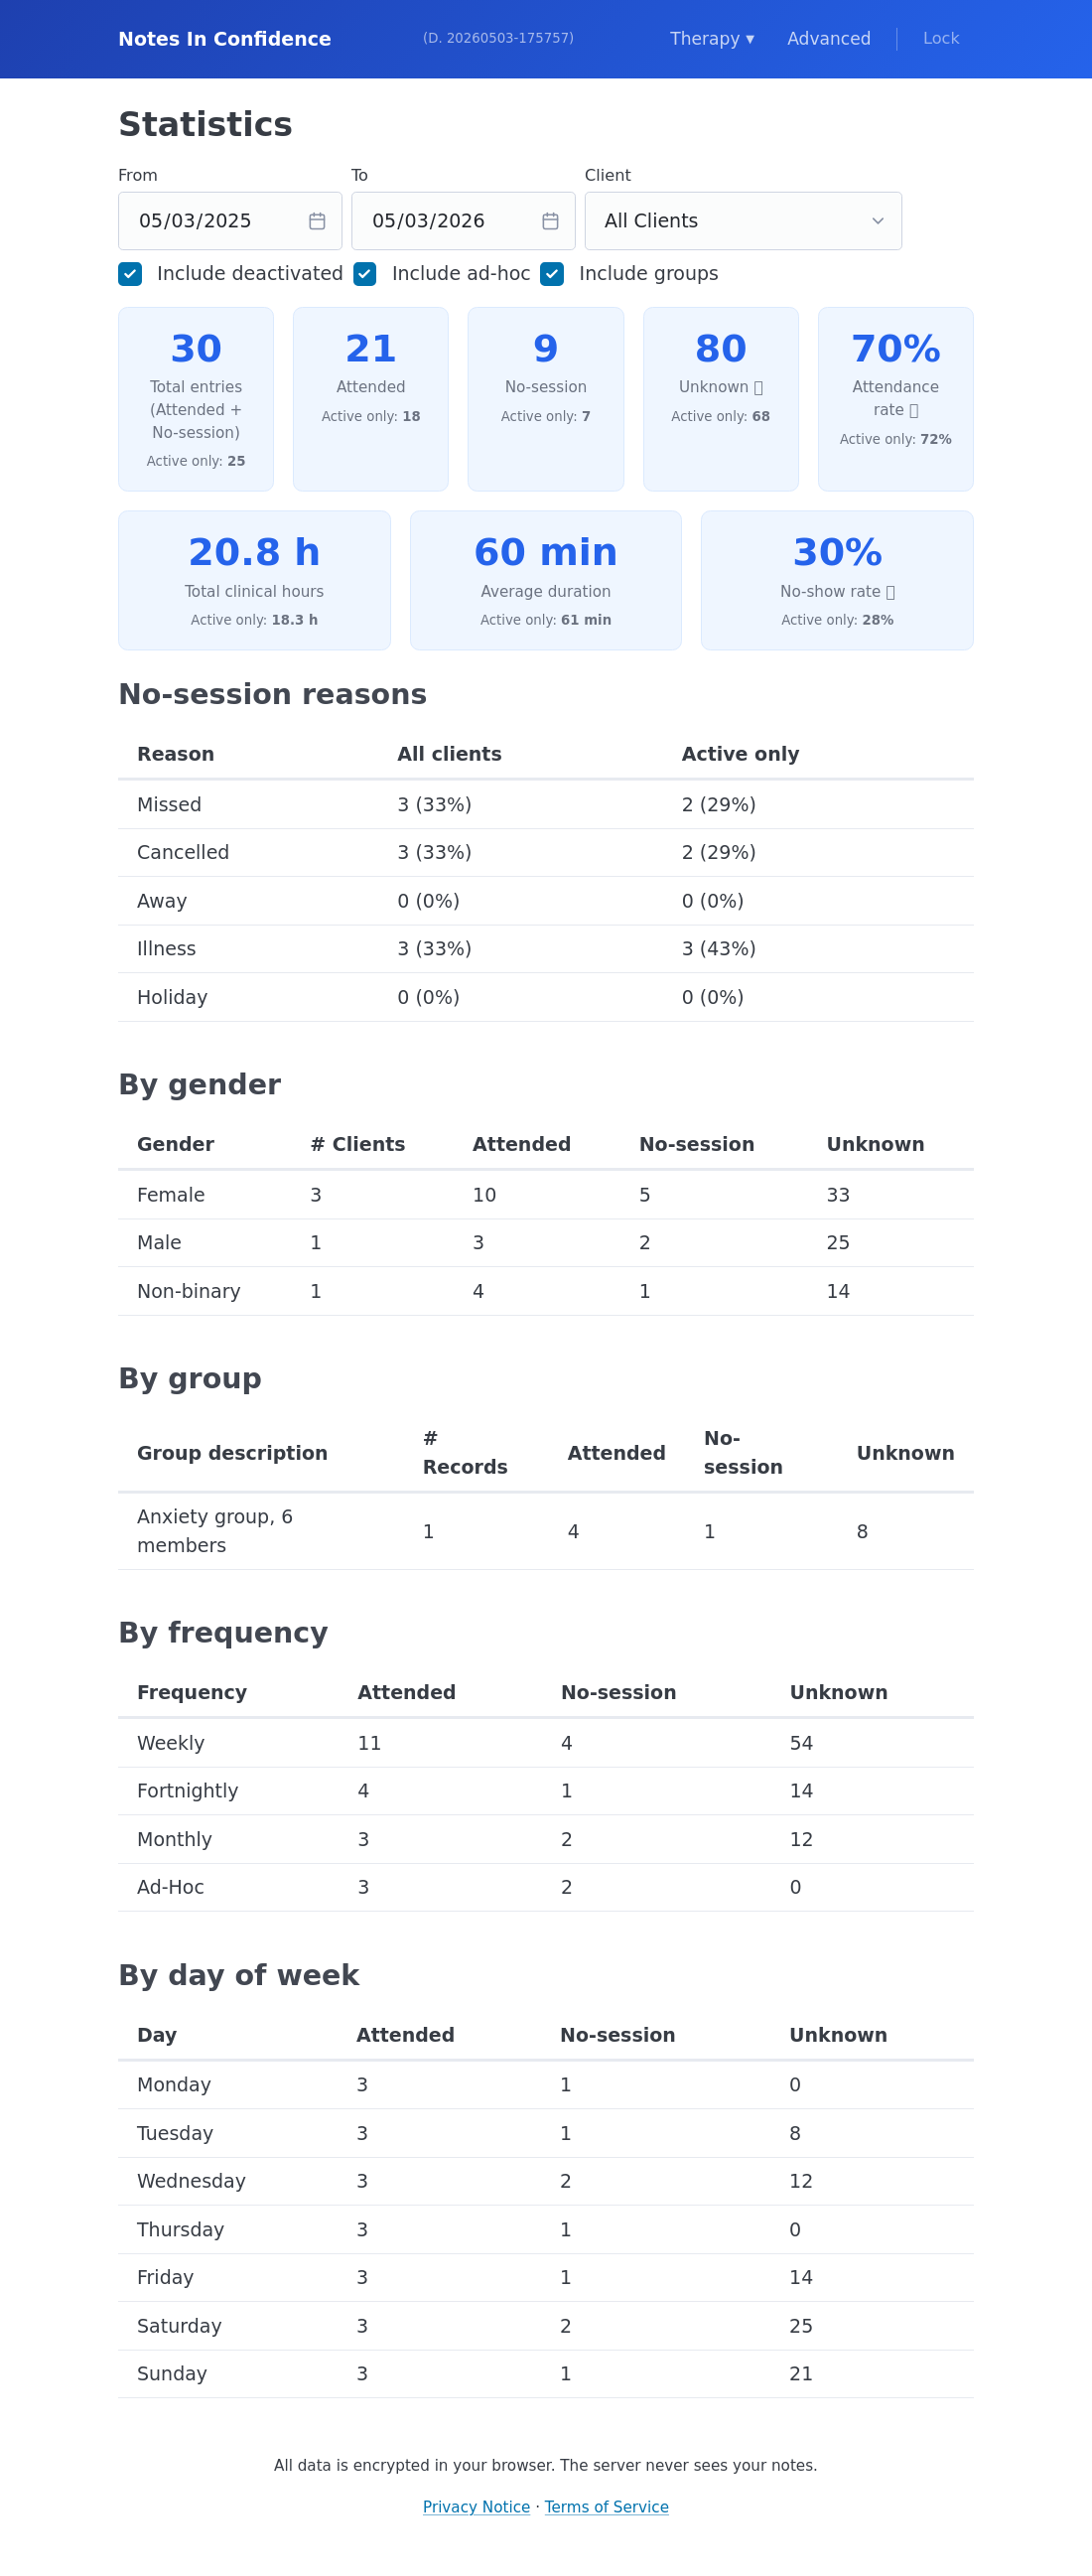
The blue cards at the top are the at-a-glance numbers for whatever filter you have set.
Total entries is every note record that fell inside your date range, attended or not. Below it in smaller text is Active only, which is the same count restricted to clients who were active at the time the note was written. The Active only number uses the deactivation history (see Tracking when a client was active) to know whether the client was active on the date of each note.
Attended is the subset that were full sessions, not no-sessions. No-session is the count of notes with the No session box ticked.
Unknown is the count of notes the page could not classify as active or inactive at the time they were written, because the client has no deactivation history at all. New clients you have never deactivated have no history, so every one of their notes lands in Unknown. This is not a problem and not a bug: it is the page being honest about the fact that, without history events, it cannot tell you whether the client was active or not at the moment of any given note. If you care about the Active only figures being accurate for a client, deactivate and reactivate them once to seed the history; the article Tracking when a client was active covers how.
Attendance rate below those is Attended / Total expressed as a percentage. Total clinical hours sums the duration of attended sessions, in hours. Average duration is the mean attended-session length in minutes. No-show rate is the inverse of attendance.
The breakdown tables
Below the headline cards are five breakdowns, each respecting the filters you set. Each table has the same column shape: a record count, an attended count, a no-session count, and (where active-history is meaningful) an unknown count.
No-session reasons breaks the no-sessions into Missed, Cancelled, Away, Illness, and Holiday. The Active only column on the right uses the deactivation history to scope to only the clients who were active when the no-session was logged.
By gender groups clients by their stored gender label. Groups appear with whatever you typed into the Group description field. If you left gender blank for a client, that client appears under "(blank)".
By group shows only the clients you ticked Group for. Each row is the group's description, which is why we recommend a useful description like "Anxiety group, 6 members" rather than just "Group".
By frequency groups clients by their Weekly / Fortnightly / Monthly / Ad-Hoc setting on the client form. Useful for spotting where your week's load actually sits.
By day of week uses the date of each note (not the client's scheduled day) to bin sessions into Monday-to-Sunday. So if a client whose scheduled day is Tuesday actually came on a Wednesday for one session, that session counts toward Wednesday in this table.
The numbers update live
The Statistics page does not cache. Every time you load it, it reads your current vault contents from the encrypted local cache, decrypts the headers, and runs the aggregation. So if you save a note in another tab and then refresh Statistics, the new note shows up immediately. The server is never queried; the figures cannot be wrong because of stale data on someone else's machine.
What to do next
If your Unknown counts are higher than feels right, the article Tracking when a client was active explains how the deactivation history works and how to backfill it for a client whose record is incomplete.
If you want to share an aggregate view with a supervisor without sharing the underlying notes, take a screenshot of the Statistics page after setting the filters you want. The page contains no clinical content at all, only counts and durations, so it is safe to share by the same channels you would use for any other anonymised summary.